The median home price in Roseville sits between $625,000 and $650,000 as of mid-2026. Buyers looking at Placer County are encountering a fast-paced environment where available listings move quickly. Properties spend an average of just 19 days on the market before going under contract.
Understanding the Roseville, CA real estate market requires looking closely at the current balance between buyer demand and available housing. With roughly 280 active listings across the city, choices remain tight for incoming residents. Sellers currently hold an advantage, but buyers who understand local pricing can still secure a property without overpaying.
Housing Styles Across the City
Older neighborhoods in East Roseville feature established single-family homes with mature trees and larger lot sizes. These properties often showcase varied architectural designs built over several decades. Buyers interested in these areas will find established communities that do not always require homeowners association fees.
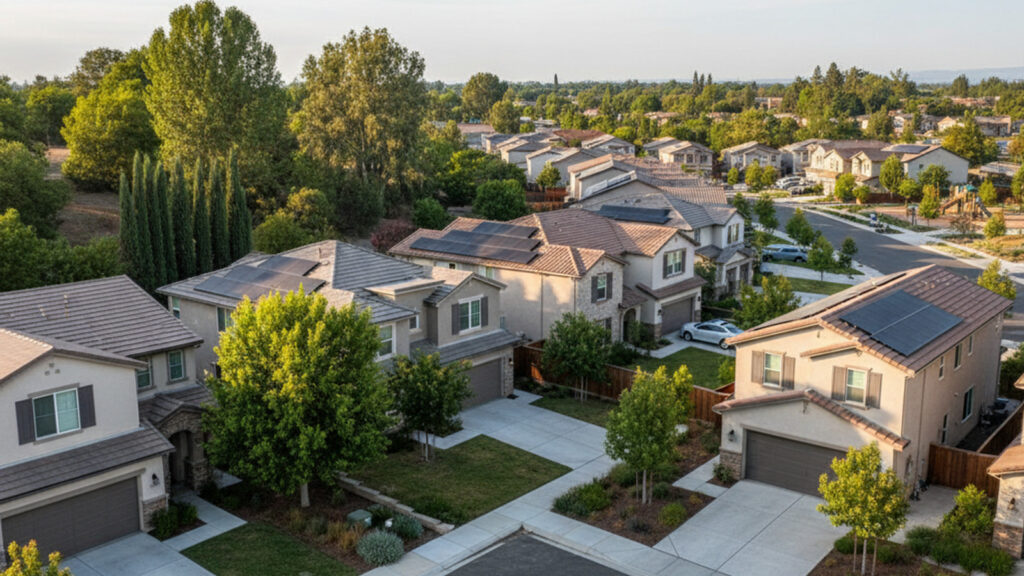
Moving toward the newer sections of town, West Roseville offers a different landscape dominated by recent construction. Master-planned communities like Westpark and Fiddyment Farm provide modern tract homes with updated energy-efficient features. These neighborhoods often include structured HOA fees that cover shared amenities and common area maintenance.
New construction continues to expand the local footprint, giving buyers options to customize finishes before move-in. These developments typically feature smaller lot sizes than the older East Roseville properties. Buyers should weigh the benefit of a brand-new home against the ongoing costs of community assessments.
Commute Routes and Travel Times
Most residents commuting to downtown Sacramento, CA spend 25 to 40 minutes on the road during standard morning hours. Interstate 80 serves as the primary artery connecting Placer County to the broader capital region. Drivers can access the interstate from multiple points across the city.
The Highway 65 interchange introduces a known bottleneck into the daily drive. Traffic along this corridor can add 15 to 20 minutes to a morning commute during peak travel times. Buyers should map the distance from a potential house to the nearest highway ramp to estimate their daily travel.
Local public transit offers an alternative for those looking to avoid highway driving. The Roseville Transit system operates multiple routes connecting residential areas to commercial hubs.
- Local bus routes serve major thoroughfares and retail centers.
- Commuter routes provide direct morning and evening service to downtown Sacramento.
- Dial-A-Ride options offer shared-transit service for registered riders.
Retail Centers, Parks, and Schools
The Westfield Galleria and Fountains at Roseville anchor the retail landscape along the Highway 65 corridor. These outdoor and indoor shopping centers provide immediate access to national retailers, local boutiques, and dining options. Residents across the city routinely travel to this district for daily shopping needs.
The city maintains an extensive network of public parks and paved bike trails. These paths connect residential subdivisions to open green spaces and recreational facilities. Buyers often prioritize properties located within walking distance of these municipal trailheads.
Local education operates primarily under the Roseville Joint Union High School District. Campuses like Woodcreek High and West Park High serve students across different municipal zones. Additionally, homes in this area benefit from Roseville Electric, a municipal utility that often results in lower monthly power bills compared to neighboring PG&E territories.
Buying and Selling Strategies for 2026
With homes averaging just 19 days on the market, sellers can expect rapid activity if they price their properties correctly. Listing a home near the $625,000 to $650,000 median price point frequently attracts multiple interested parties. Sellers should review recent comparable sales to avoid overpricing, which can cause a property to stagnate even when inventory is low.
Buyers face a competitive environment where hesitation often leads to missed opportunities. Submitting a strong initial offer is a better approach than waiting for a counteroffer that may never materialize. Current interest rates also shape mortgage affordability, meaning buyers should finalize their financing before touring homes.
Working with a local real estate agent helps both parties interpret recent MLS data. Agents can identify micro-trends within specific Placer County neighborhoods that broader city data might miss. Anyone entering the market should base their decisions on the latest available sales figures.
Common Questions About Roseville Real Estate
Is Roseville currently a buyers or sellers market?
Sellers currently hold the advantage due to limited available housing. With roughly 280 active listings and an average market time of 19 days, demand outpaces supply. Buyers should prepare to act quickly when a desirable property appears.
How much does a house cost in Roseville, CA right now?
The median home price ranges from $625,000 to $650,000. Prices vary based on the age of the home and its location within the city. New construction in master-planned communities often commands a premium over older properties.
What is the difference between West Roseville and East Roseville?
East Roseville features older, established neighborhoods with mature landscaping and larger lots. West Roseville is defined by recent development, offering modern tract homes and master-planned communities. Buyers looking for new construction generally focus their search on the western side of the city.